|
|
Math 122 - Calculus for Biology II |
|
|---|---|---|
|
|
San Diego State University -- This page last updated 27-Aug-11 |
|
Trigonometric Functions - Examples
|
|
Math 122 - Calculus for Biology II |
|
|---|---|---|
|
|
San Diego State University -- This page last updated 27-Aug-11 |
|
This section starts with basic conversions from degrees to radians and finding the values of the sine and cosine functions at certain angles. There are graphing examples using the basic trigonometric functions. An application to circadian rhythms and body temperature using the cosine function ends this section.
Example 1: Radians, Sine, and Cosine. Do not use a calculator for these.
a. Find the radian measure for the following angles given in degrees:
b. Determine the value of both sin(x) and cos(x) for each of these angles.
Solution: a. Recall the conversion formula in the main lecture section. It states that 1o = p/180 radians. Thus, given an angle in degrees x the radian measure r is given by the formula
The answers become fractional multiples of p. For example, when x = 135o, then the radian measure is
The list of the angles above can be easily converted as shown above to yield the following for all of the angles x listed above,
See the table below for a more more complete listing.
b) To find the sine and cosine values for these angles without the use of a calculator, we refer to the table of important values to remember and use the geometry from the circle. If the angle is located in any quadrant other than the 1st quadrant, then we need to find the reference angle. The reference angle is an angle between 0 and p/2 that is made with the x-axis. For example, the angle 7p/6 lies in the 3rd quadrant, and there is an angle of p/6 radians between this ray (when viewed from the circle perspective) and the negative x-axis, giving a reference angle of p/6 radians. The reference angle gives the magnitude of the sine and cosine functions, then we assign a sign to the function based on which quadrant it lies. Both sine and cosine are positive in the 1st quadrant. The sine is positive and the cosine is negative in the 2nd quadrant, while both are negative in the 3rd quadrant. In the 4th quadrant, the cosine is positive and the sine is negative.
The angles that lie on either the x or y-axes are special ones that you should
get to know very well to make it much easier to sketch graphs of the
trig functions. The angles r =
0,
p/2, and 3p/2
are special angles on the axes, while the others (except r = p/6) require
finding the reference angle and which quadrant they reside. We see
that when r = 3p/4 or 7p/4, the
reference angle is p/4, yielding the magnitude of both sine and
cosine functions as ![]() from the table. However, the first of these is in the
2nd quadrant, while the second is in the
3rd quadrant. Since we discussed the angle 7p/6, the
remaining angle is r = 4p/3. It has a
reference angle of p/3 and resides in the 3rd
quadrant.
from the table. However, the first of these is in the
2nd quadrant, while the second is in the
3rd quadrant. Since we discussed the angle 7p/6, the
remaining angle is r = 4p/3. It has a
reference angle of p/3 and resides in the 3rd
quadrant.
Below we present a table summarizing our results.
|
|
|
|
|
|
|
|
|
|
|
|
|
|
|
|
|
|
|
|
|
|
|
|
|
|
|
|
|
|
|
|
|
|
|
|
|
|
|
|
Example 2: Graphing the Sine Function. Sketch the graph of the following function:
for -2p < x < 2p. Determine the amplitude and period of oscillation for this function. Find all maxima and minima in the specified domain.
Solution: As we saw in the main lecture section, this function is shifted verticallydownward by the constant -2. The amplitude is given by 3 (multiplying the sine function), so the graph will oscillate between -5 < y < 1. These high and low points of the graph are found by letting the sine function take its maximum and minimum values given by 1 and -1, respectively. The maximum occurs when the argument of sine 2x = p/2 or x = p/4. This gives
y(p/4) = 3(1) - 2 = 1.
Similarly, the minimum occurs when the argument of sine 2x = 3p/2 or x = 3p/4. This gives
y(3p/4) = 3(-1) - 2 = -5
To find the period, T, we solve
Thus, the period of this function is p.
The best way to sketch a graph of either the sine and cosine function is to take the period of the function, then divide it into 4 even parts. For this example, we divide the interval [0, p] into 4 parts. Next you evaluate the function at each of the endpoints of these subintervals, which for this case occurs at 0, p/4, p/2, 3p/4, and p. We obtain the following:
This takes on the important values (minima and maxima) and goes through one cycle, which makes the sketching easy. One simply repeats the graph to extend it. Below is a graph of this function.
Since this function is periodic with period p and a maximum of y = 1 occurs at x = p/4, there are the other maxima at x = p/4 - 2p = -7 p/4, p/4 - p = -3p/4, and p/4 + p = 5 p/4. Since a minimum of y = -5 occurs at x = 3p/4, we can add and subtract integer multiples of p to obtain the other minima at x = -5p/4, -p/4, and 7p/4.
Phase shifts are important matching data in periodic models. The easiest model to match a phase shift is the cosine model, since the maximum of the cosine function occurs when the argument is zero. The next example explores graphing the cosine model with a phase shift and gives the corresponding sine model that produces the same graph.
Example 3: Graphing the Cosine Function. Consider the following cosine model, which includes a phase shift:
for -4p < x < 4p. Find the vertical shift, amplitude, period, and phase shift for this model. Determine all maxima and minima in the domain. Finally, find the equivalent sine model with the principle phase shift (a phase shift, 0 < f < T, where T is the period of the model.
Solution: From the form of the model it is easy to read off the vertical shift, given by A = 4. The amplitude is similarly easy to read as B = 6. Similarly, the frequency of the model is w = 1/2. This allows computation of the period, T,
T/2 = 2p, so T = 4p.
The phase shift is easily read as f = p.
The phase shift indicates that this is a cosine function shifted horizontally x = p units to the right. Since the cosine function has a maximum value when its argument is zero, this model will achieve a maximum at x = p. With the period being T = 4p, the easiest way to graph this function is to start at x = p and proceed to x = 5p, completing one period. Then we use the periodicity to get the desired graph over the domain.
The significant points for evaluation are always each quarter of the period. Thus, for this model the points of interest will be x = p, 2p, 3p, 4p, and 5p. (Note that the last point is outside the domain.) We substitute these values into the cosine model to complete one period, giving
Since this function has period, T = 4p, we cycle backwards one and a quarter periods to easily obtain the values of the model with y(0) = 4, y(-p) = -2, y(-2p) = 4, y(-3p) = 10, and y(-4p) = 4. The graph is readily produced from the function evaluations given on the domain -4p < x < 4p.
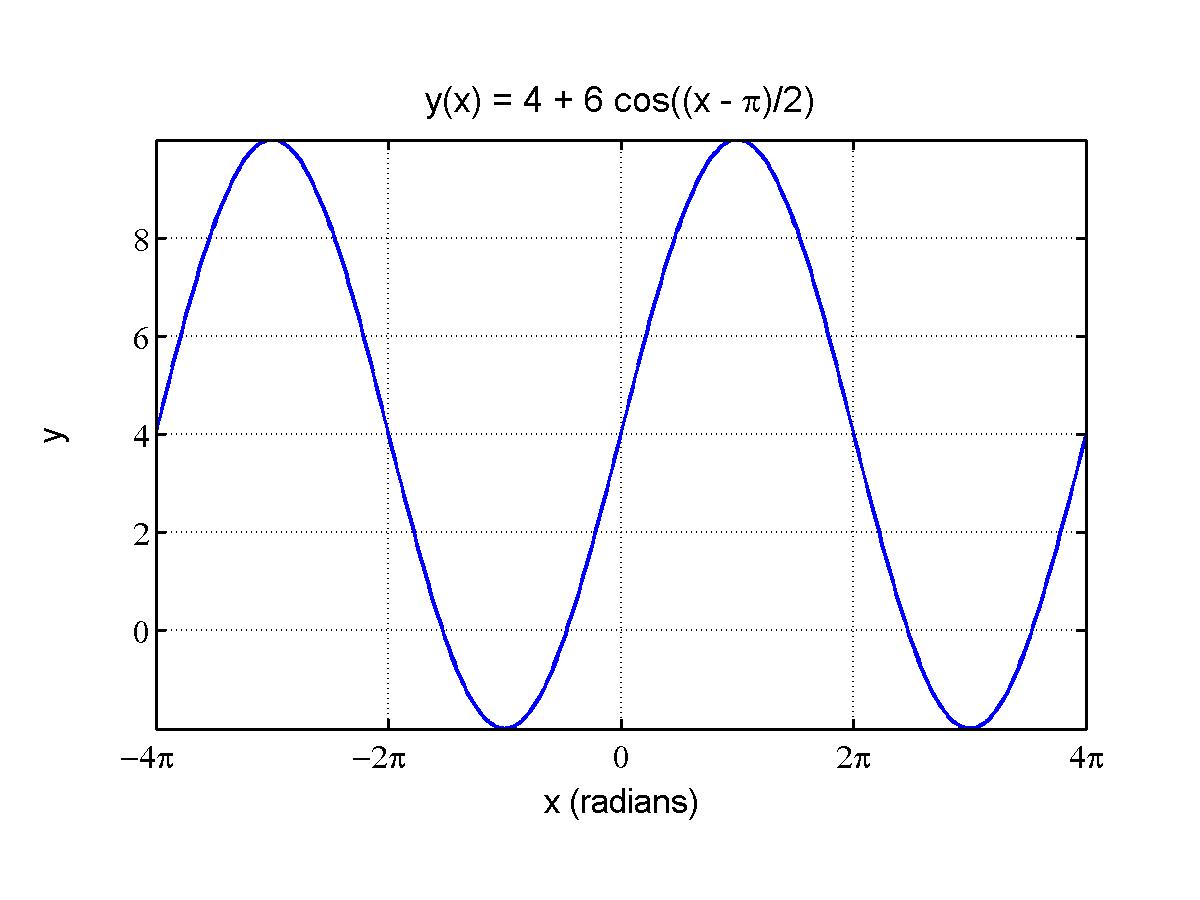
Observing the graph, we see that the model is vertically shifted by y = 4 and oscillates about this line. As noted above, it has an amplitude of B = 6, so oscillates 6~units above and below this average line with a period of T = 4p. Finally, we note that this cosine function is shifted to the right by the phase shift, f = p.
From either the graph or the values computed above, we see that in the domain, this model has maxima of y(xmax) = 10 at xmax = -3p and p. The model has minima of y(xmin) = -2 at xmin = -p and 3p.
A closer look at the graph above indicates that this model looks more like a standard sine function model. Suppose we want to use the sine model
y(x) = A + B sin(w(x - f))
Since we want the graph to be identical, the vertical shift, amplitude, and period must be the same, so A = 4, B = 6, and w = 1/2 or
y(x) = 4 + 6 sin((x - f)/2)
It remains to find the appropriate phase shift, f.
A previous example showed that the cosine function is horizontally shifted to the left by p/2 of the sine function. Thus,
cos((x - p)/2) = sin((x - p)/2 + p/2) = sin((x - f)/2).
It follows that we want
(x - p)/2 + p/2 = (x - f)/2 or f=2
Thus, there is no phase shift for the sine model, and the equivalent sine model
is given by
y(x) = 4 + 6 sin(x/2).
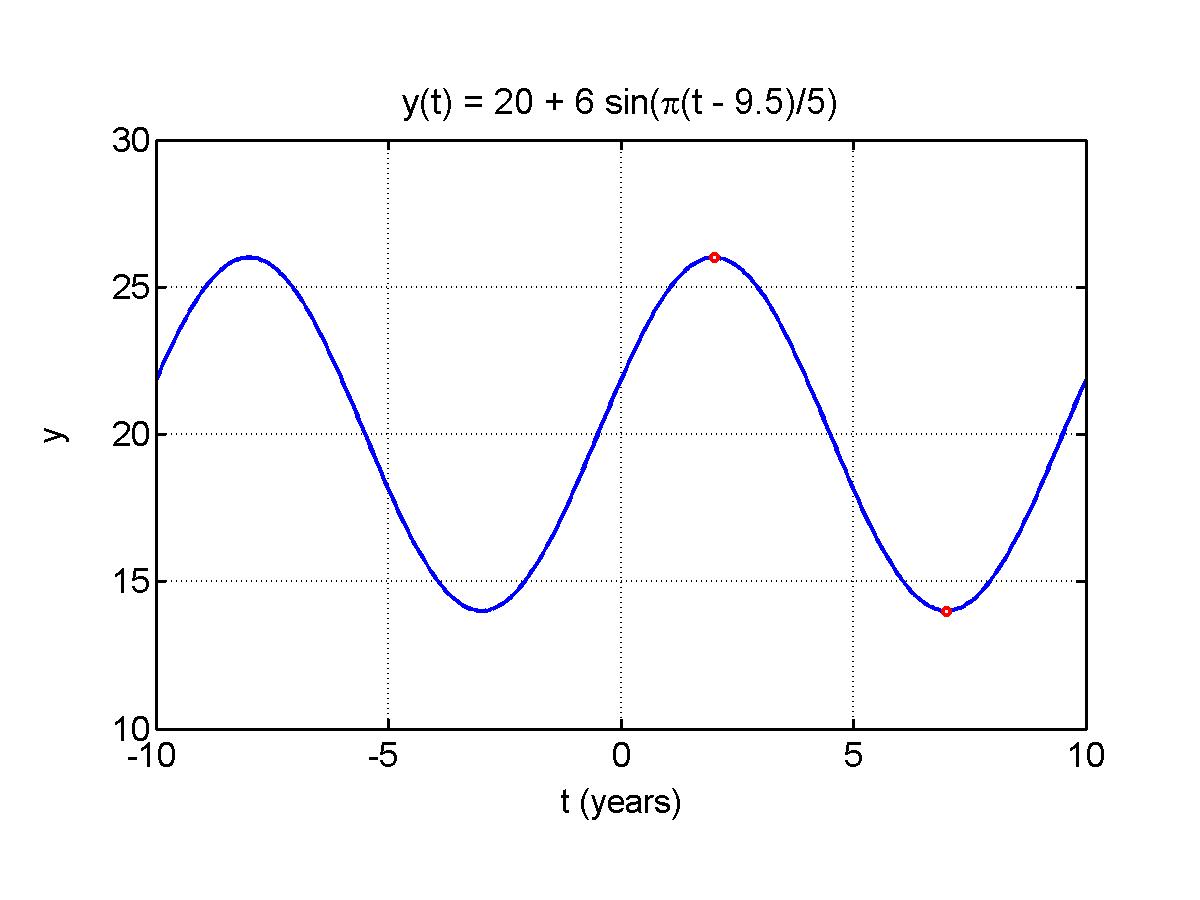
Example 4: Population Model with Phase Shift. Consider an oscillatory set of population data that is periodic with a period of 10 yr. Suppose that there is a maximum population (in thousands) of 26 at t = 2 and a minimum population (in thousands) of 14 at t = 7 . Assume these data fit a model of the form
y(t) = A + B sin(w(t - f)).
Find the appropriate constants A, B, w, and f. Choose B > 0 and w > 0, then find 0 < f < 10. Since f is not unique, find values of f with -10 < f < 0 and 10 < f < 20. Graph the model. In addition, repeat this process for the cosine model
y(t) = A + B cos(w(t - f2)).
Solution: The vertical shift, A, is the average of the high and low points of the data, so
A = (26 + 14)/2 = 20.
The amplitude, B, is the distance from the maximum to the average, so
B = 26 + 20 = 6.
Since the period is T = 10 years, the frequency, w, satisfies
w = 2p/10 = p/5.
Note that the times of the maximum and minimum are separated by half a period. This will always be the case of our sine and cosine models.
We are given that the maximum of 26 occurs at t = 2, so the model satisfies:
y(2) = 26 = 20 + 6 sin((p/5)(2 - f)).
From this equation it is clear that
sin((p/5)(2 - f)) = 1 .
Recall that the sine function is at its maximum with value one when its argument is p/2, so
(p/5)(2 - f)) = p/2
2 - f = 5/2
f = -1/2.
This value of f is not in the interval [0, 10), but the periodicity, T = 10, of the model is also reflected in the phase shift, f. We can write
f = -1/2 + 10n for n an integer
f = ..., -10.5, -0.5, 9.5, 19.5, ...
with the principle phase shift being f = 9.5. It follows that we can write the sine model
y(t) = 20 + 6 sin((p/5)(t - 9.5)),
and its graph is below. From the formula for f, we could also use phase shifts of f = -0.5 or f = 19.5.
The cosine model has the form
y(t) = 20 + 6 cos((p/5)(t - f2)),
where the vertical shift, amplitude, and frequency match the sine model. It remains to find the phase shift, f2. The maximum of the cosine function occurs when its argument is 0, so
(p/5)(2 - f2) = 0
f2 = 2.
It follows that the cosine model satisfies
y(t) = 20 + 6 cos((p/5)(t - 2)).
By periodicity of the phase shift, we have
f2 = 2 + 10n for n an integer
f2 = ..., -8, 2, 12, 22, ...
where the principle phase shift is f2 = 2.
Solution: Use the things we know to find some of the constant parameters. In this problem,we know that one day is 24 hours, so the period of the function is 24. (Be careful not to confuse the temperature T(t) with our previous notation of T as the period.) The frequency is given by w = 2p/24 = p/12 We can also find the mean (average) temperature , half-way between the extreme values